Personal Update: Going full time on Grafana

It’s been a year since I started at Raintank (soon to be renamed to GrafanaLabs). During that time, I have worked on lots of interesting stuff. Some highlights:

I’ve learnt a lot. The biggest change being the switch from Windows to Linux. I have worked on projects in Node and Go, both new languages for me. It’s been intensive but now it is going to get even more intensive!

As one of my colleagues in the Stockholm office, Carl, is gone on parental leave for a few months, we decided that now was a good time for me to start focusing on Grafana full time.

It’s a bit mad starting to work on Grafana due to the sheer volume of issues, comments on issues, PR’s, questions on the forum, questions on StackOverflow, questions on our public Slack channel, comments on Twitter and questions on the #grafana channel on IRC. Torkel even answers questions on Google+!

It’s very obvious from the outside that Grafana is a really popular project. It has just under 15 000 stars on GitHub and a look at the GitHub pulse shows a lot of activity – during the last month there have been 58 active pull requests and 252 active issues.

GitHubPulse

But what those stats do not show is the number of comments on issues, a lot of them on closed issues. Grafana currently has 900 open issues (570 of those are feature requests) but if you count closed issues and pull requests then there are more than 7000. Carl and Torkel have closed tons of issues and pull requests over the last 12 months but they have also answered tons of follow up questions on closed issues. Since I started writing this blog post a few minutes ago, 12 13 14 notifications from GitHub for Grafana issues have landed in my gmail.

It’s crazy that just two full time people have kept up this furious tempo. You’re machines, Torkel and Carl!

The Grafana community is still growing rapidly and it is noticeable that merging pull requests and answering issues generates more pull requests and feature requests. Hopefully we’ll be growing our team soon so that we can work on more of those 500+ feature requests! The future looks very exciting (and busy).

Graphite and Grafana – How to calculate Percentage of Total/Percent Distribution

When working with Grafana and Graphite, it is quite common that I need to calculate the percentage of a total from Graphite time series. There are a few variations on this that are solved in different ways.

SingleStat

diskusagesinglestat

With the SingleStat panel in Grafana, you need to reduce a time series down to one number. For example, to calculate the available memory percentage for a group of servers we need to sum all available memory for all servers and sum total memory for all servers and then divide the available memory total by the total memory total.

The way to do this in Grafana is to create two queries, #A for the total and #B for the subtotal and then divide #B by #A. Graphite has a function divideSeries that you can use for this. Then hide #A (you can see that is grayed out below) and use #B for the SingleStat value.

The divideSeries function can be used in a Graph panel too, as long as the divisor is a single time series (for example, it will work for the sum of all servers but not when grouped by server).

diskusagesinglestatqueries

Graph Multiple Percentage of Totals

diskusagepernodegraph

Sometimes I want to graph the percentage of total grouped by server/node e.g. disk usage percentage per server. In this case, divideSeries will not work. It cannot take multiple time series and divide them against each other (Prometheus has vector matching but Graphite does not have anything quite as smooth unfortunately). One way to solve this is to use a different graphite function called reduceSeries.

diskusagepernodegraphquery
Query to calculate subtotals for multiple time series
diskusagebynodequerysnippet
Same query – zoomed in on the end of the query

In the example, there are two values, capacity (the total) and usage (the subtotal). First, a groupByNode function is applied, this will return a list with the two values for each server (e.g. minion-2.capacity and minion-2.usage). The mapSeries and reduceSeries take this list and for each server applies the asPercent reduce function to the two values. The result is a list of percentage totals per server.

The reduceSeries function can also apply two other reduce functions: a diff function and a divide function.

Same result with the AsPercent Function

In the query above, the values (usage and capacity) are in the same namespace if that is not the case then the reduceSeries technique will be difficult or not work. Another function worth checking out is the AsPercent function which might work better in some cases. The example below uses the same two query technique that we used for divideSeries but it works with multiple time series!

diskusageaspercentquery

I learned these three techniques by looking at Grafana dashboards built by some of the Graphite experts that work with me at Raintank/Grafana Labs. I did not know them before so I think they will help others too.

Profiling Golang Programs on Kubernetes

Recently I needed to profile a Go application running inside a Kubernetes pod using net/http/pprof. I got stuck for a while trying to figure out how to copy the profile file from a pod but there is an easier way.

net/http/pprof – A Short Intro

First, a little about profiling in Go. net/http/pprof is a library for profiling live Go applications and exposing the profiling data via HTTP. If you want to profile an application, it needs to be instrumented before profiling. Here are some articles that describe that process:

Once you have instrumented your application, you just need to be able to access it from outside of a Kubernetes cluster.

Kubernetes and Pprof

The easiest way to get at the application in the pod is to use port forwarding with kubectl.

kubectl port-forward pod-123ab -n a-namespace 6060

The HTTP endpoint will now be available as a local port.

You can now generate the file for the CPU profile with curl and pipe the data to a file (7200 seconds is two hours):

curl "http://127.0.0.1:6060/debug/pprof/profile?seconds=7200" > cpu.pprof

It is also possible to send the data directly to the pprof tool. The pprof tool (not the same thing as the net/http/prof library) is a tool for generating a pdf or svg analysis from the profile data.

To save the pprof data with the pprof tool you can use the interactive mode:

go tool pprof http://localhost:8282/debug/pprof/profile

And per default the generated data will be saved as a tar file in the pprof subdirectory in your home directory. Exit interactive mode by typing exit.

Congratulations, you now have the raw profile from your application from inside a Kubernetes pod!

Some bonus information on the pprof tool

To generate an analysis, you will need the binary file for your Go application.

Here is how to pipe the profile data in directly:

go tool pprof --pdf your-binary-file http://localhost:8282/debug/pprof/profile > profile.pdf
go tool pprof --svg your-binary-file http://localhost:8282/debug/pprof/profile > profile.svg

You can do a lot more with net/http/pprof and the pprof tool.

Memory profile for in use space:

go tool pprof --pdf your-binary-file http://localhost:8282/debug/pprof/heap > in-use-space.pdf

Memory profile for allocated objects:

1. Generate the data:

go tool pprof http://localhost:8282/debug/pprof/heap

2. Exit interactive mode by typing exit.
3. Analyse the data:

go tool pprof -alloc_objects --svg your-binary-file /home/username/pprof/pprof.localhost:6060.alloc_objects.alloc_space.003.pb.gz > alloc-objects.svg

There are also switches for in use object counts (-inuse_objects) and allocated space (-alloc_space).

The pprof tool has an interactive mode that has lots of nifty functions like topn. Read more about that on the official Go blog.

Review of Release It!

Release It! Design and Deploy Production-Ready Software by Michael T. Nygard, published by The Pragmatic Programmers.
ISBN: 978-0-9787-3921-8

Introduction

Release It! is a book I have had on my reading list for a few years. I started a new job at Tradera/eBay Sweden in June last year and Release It! felt more relevant to my work than ever before. It’s the first time in my career that I am working on a public site with a lot of traffic (well, a lot for Sweden anyway). Downtime can mean a lot of lost revenue for my company. As I’m on call every second month for a week at a time, downtime also really affects how much sleep I get during that week. So perfect timing to read a book about pragmatic architecture.

System downtime can both cost huge amounts of money and seriously damage the reputation of a company. The incident that springs to mind when I think about damage to a company’s reputation is the Blackberry three day outage in 2011. It was the beginning of the end for a previously very successful company. Release It! is all about building a pragmatic architecture and infrastructure to avoid one of these doomsday scenarios for your company.

The book is organised into four different parts and roars into action with the first part: Stability or how to keep your system up 24 hours a day.

The Exception That Grounded An Airline

The author Michael Nygard has worked on several large, distributed systems and uses his war stories to illustrate anti-patterns.

The first story is of a check-in system for an airline that crashes early in the morning – peak time for check-ins. First, he describes the process of figuring out which servers were the problem (they had no errors in their logs). They then took the decision to restart them all. This restart took three hours and caused so many flight delays that it made the TV news. The post-mortem involved thread dumps and decompiling production binaries (there was bad blood between the developers and operations so they weren’t too keen to give him the source code). The bug turned out to be an uncaught sql exception that only ever got triggered during a database failover.

I love the this way of illustrating technical concepts. The stories are great and make the book a very easy read despite it being quite technical. And the postmortems after the incident are like CSI for programmers.

The lesson learned in this case was that it is unlikely that you can catch all the bugs but that you CAN stop them spreading and taking down the whole system. This bug was a simple bug but one unlikely to be ever caught in testing. Who tests that code works during database failovers and has that setup in their test environment?

However, by failing fast and using patterns like timeouts or circuit breakers you can stop the problem spreading through the whole system and crashing everything.

Cascading Failures vs Fail Fast

Circuit-breaker at High Voltage test bay, BerlinAfter setting the scene, the author then introduces a group of Stability anti-patterns. They have great names like Cascading Failures and Attacks of Self-Denial. These anti-patterns represent all the ways you can design an unstable system.

To counteract these anti-patterns are a group of Stability patterns.These include some very useful patterns like the practice of using timeouts so that calls don’t hang forever. Fail Fast counteracts the Cascading Failure anti-pattern. Instead of an error being propagated from subsystem to subsystem crashing each one, the idea is to fail as fast as you can so that only the subsystem where the error occurred is affected.

The most interesting pattern for me was the Circuit Breaker pattern. I haven’t used it yet in a production system but it got me looking at a .NET implementation called Polly.

Anyone else used it in a production system?

Capacity

The second part of the book introduces the capacity theme with a story about the launch of a retailer’s new website. They deployed the site at 9 a.m. and by 9:30 a.m. it had crashed and burned. Total nightmare. One of the sysadmins had a 36 hour shift setting up and deploying new app servers.

Again the author introduces a group of anti-patterns to watch out for and some patterns to counteract them. This time the anti-patterns are more obvious and are mostly some sort of waste of resources. They can be seemingly insignificant anti-patterns like not creating indexes for lookup columns in a database table, session times that are too long (a session in memory is using valuable memory), sending too much data over the wire or cookies that are too large. For a small system these are not a problem but if you multiple them with thousands of concurrent users then a lot more servers will be needed.

Michael Nygard makes a very good point here that most developers have less than 10 years of experience and most systems that are built do not have capacity problems; the combination of these two statistics means that very few developers have experience of working on large systems. This also means that the same mistakes are repeatedly made when designing large systems.

I personally still have a lot to learn here. I will be digging deeper into load testing and some of the more technical details of how our servers are configured. It’s easy to forget about how the code that I write affects the production environment.

General Design Issues

This part of the book is a collection of disparate design issues that can be important for large systems. Networking, security, load balancing, SLA’s, building a QA environment and other topics are covered here. Interesting stuff if not as compelling as the first two parts of the book.

Operations

The last part of the book kicks off with another great war story about a site suffering performance problems on Black Friday (the day after Thanksgiving in the US when every shop in the country has a sale). This time the problem was caused by an external system run by another company that had taken down two of its four servers for maintenance (on the busiest day of the year!). They were able to save the situation by reconfiguring a component not to call the external servers. This was possible due to good component design that allowed them to just restart the component instead of the server (it would have taken 6 hours to restart all the servers). The site was back working within a few minutes.

Transparency

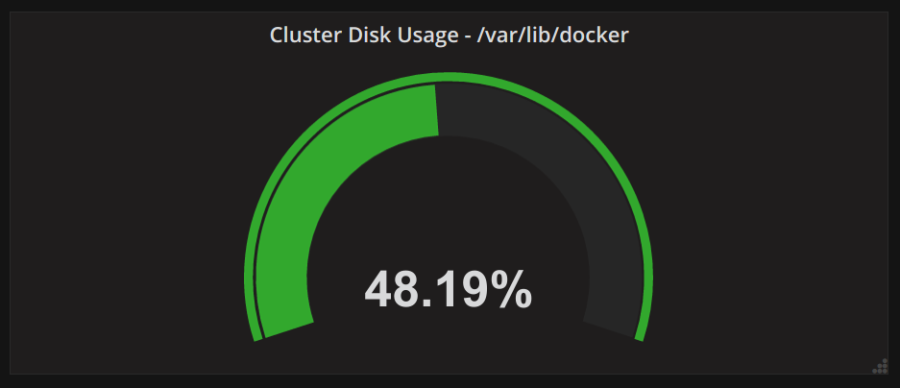
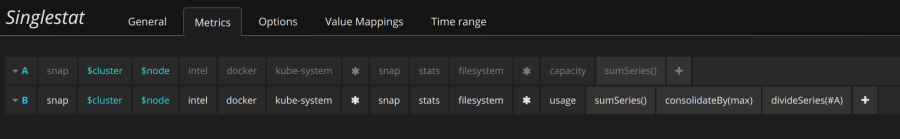
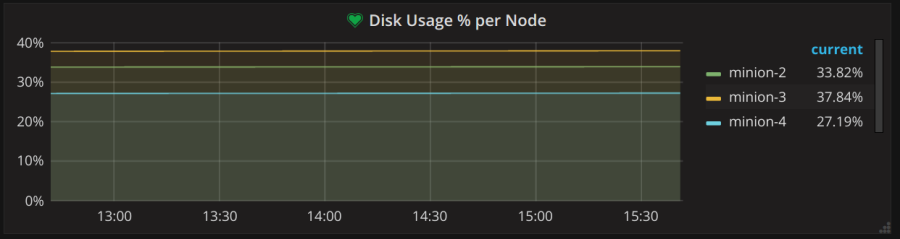
So how did they know so fast what was wrong in this case? They had built the system to be transparent. Most systems are black boxes that do not allow any sort of insight into how healthy it is. To make a system transparent it is has to be designed to reveal its current state and a monitoring infrastructure is needed to create trends that can be easily analyzed by a human.

For example, at Tradera/eBay Sweden for our frontend servers we can see the number of errors per minute, page response time (both client and server side) and number of 404 and 500 HTTP response per minute (as well as lots of other measurements). For each server we can see memory usage, number of connections and a host of other performance indicators. By just glancing at our dashboard for live statistics I can see if we are suffering any performance issues on the frontend. Without this help it would be extremely difficult to keep the system running when things go wrong. As you can see this theme is close to my heart!

I did get a bit lost in the technical details of this section however. It is a really interesting theme but the technical details are either JVM-specific or have not aged well. A lot has happened in this space since the book was written in 2007.

Verdict

If you work with a system that is deployed on more than ten servers then this book is a must-read. There is a difference between just writing code and keeping a system up 24 hours a day. If you burn for Devops or are on-call regularly or care about creating stable systems then this book is for you.


FluentMigrator – Setting the collation on a column

I got a question via a Twitter DM about how to set the collation for a column in a FluentMigrator migration. I gave a quick answer there but here is a longer answer for anyone stuck on this.

Using AsCustom

There is no explicit support for setting collation per column in FluentMigrator but it can be done per database. When creating a column using the WithColumn attributes you can use the AsCustom to set the type with any valid sql. This will be specific for one database and will not be translated to the correct form for other databases.

Here is an example for MS Sql Server where the “test” column’s collation is set to Latin1_General_CI_AS using the COLLATE clause:

public override void Up()
{
    Create.Table("Order")
        .WithColumn("Id").AsInt32().NotNullable().Identity().PrimaryKey()
        .WithColumn("test").AsCustom("varchar(10)COLLATE Latin1_General_CI_AS");
}

Supporting non-standard SQL for multiple databases

FluentMigrator supports a lot of databases and has fluent expressions that support most of the common scenarios for all of them. However, these databases have loads of different features like collation that are not standard ANSI SQL. FluentMigrator will never be able to support all of these. Occasionally you will need to handle edge cases like these for multiple databases.

The way to do this is using FluentMigrator’s IfDatabase. This is quite simple. Just add IfDatabase before the create expression:

IfDatabase("sqlserver").Create.Table("Order")
    .WithColumn("Id").AsInt32().NotNullable().Identity().PrimaryKey()
    .WithColumn("test").AsCustom("varchar(10)COLLATE Latin1_General_CI_AS");

IfDatabase("postgres").Create.Table("Order")
    .WithColumn("Id").AsInt32().NotNullable().Identity().PrimaryKey()
    .WithColumn("test").AsCustom("text collate \"en_US\"");

And now you can write migrations with non-standard SQL for multiple databases in the same migration.

How to catch JavaScript Errors with window.onerror (even on Chrome and Firefox)

I’m working on a new (mostly greenfield) responsive website for eBay Sweden that has a fair amount of JavaScript and  that is viewed in lots of different browsers (mobile, tablet, desktop). Naturally we want to log our JavaScript exceptions and their stacktraces, just like we log server-side exceptions. It is impossible to test every combination of device and browser so we rely on logging to find the edge cases we miss in our testing.

The way we handle our JavaScript exceptions is to:

  1. catch the exception.
  2. collect data about the useragent, context etc.
  3. Save it to our logs by sending an ajax request with the data and the exception information.

I can finally log JS Exceptions!

We decided to use window.onerror which is a DOM event handler that acts like a global try..catch. This is great for catching unexpected exceptions i.e. the ones that never occur while testing.

It is very simple to get started with, you just have to override the handler like this:

window.onerror = function (errorMsg, url, lineNumber) {
    alert('Error: ' + errorMsg + ' Script: ' + url + ' Line: ' + lineNumber);
}

But It Was Too Good To Be True

If you test this on a local server (say IIS or nginx) then it should work fine. But it is not the same as a normal try..catch, so producing a stacktrace with a library like stacktrace.js will probably not work too well. The window.onerror handler does not have the same context and the context varies enormously from browser to browser.

Also, if you have minified your files then line number is not very useful. For example:

Error: ‘a’ is undefined Script: build.js Line: 3

Variable ‘a’ is very hard to find when line 3 has 30000 characters of minified JavaScript.

Unfortunately, I do not have a solution for this for all browsers. This will get better over the next few months as a new standard for window.onerror has been agreed upon. It is already implemented for Chrome.

The new standard adds two parameters; column number and an error object.  Our window.onerror handler now looks like this:

window.onerror = function (errorMsg, url, lineNumber, column, errorObj) {
    alert('Error: ' + errorMsg + ' Script: ' + url + ' Line: ' + lineNumber
    + ' Column: ' + column + ' StackTrace: ' +  errorObj);
}

I made a little test project to see what level of support there is. It contains one test page with a button and two script files. The button triggers a function in one script file that creates an exception and the other script file contains the window.onerror handler.

As of 2014-01-18 the results were:

  • Firefox 26.0 returns the first three parameters (hopefully this will be implemented soon)
  • Internet Explorer 10 will return a column number but no error object. However by using arguments.callee.caller you can get a stacktrace.
  • Chrome 32.0.1700.76 (for desktop) returns all five parameters
  • Chrome for Android (version 32) returns all five parameters
  • Safari for iOS (6 and 7) returns the first three parameters (here is the Webkit issue)

So for older mobiles you will never be able to get decent error logging but when all the browsers have implemented this and people switch to newer phones it will get better. Not perfect but this would still be a good start if not for…

Chrome and Firefox Break It Totally For CDNs

It is actually even worse if you use a CDN for your script files. window.onerror won’t work at all in this case. If you have tried this then you have probably visited this StackOverflow page:

Cryptic “Script Error.” reported in Javascript in Chrome and Firefox

Firefox and Chrome will for security reasons not report exceptions from scripts that are of a different origin. All you get is a cryptic “Script Error.” and nothing else. Totally useless.

Solving the Cryptic “Script Error.”

The latest versions of Chrome (see point 3 in the linked post) and Firefox have now provided a way to allow reporting of exceptions from CDNs.

There are two steps to be taken to get it working:

Access-Control-Allow-Origin:*
  • Use the new crossorigin attribute on the source tag. Here is an example from our website at work:
 <script crossorigin="anonymous" src="//static.tradera.com/touchweb/static/output/script/344c8698.build.js"></script>

The crossorigin tag has two possible values.

  • anonymous means no user credentials are needed to access the file.
  • use-credentials if you are using the Access-Control-Allow-Credentials header when serving the external JavaScript file from the CDN.

Now it should work. There is one caveat here. If you have set the crossorigin attribute on the script tag then you MUST set the Access-Control-Allow-Origin header otherwise the browser will discard the script for not having CORS enabled.

At the moment, we filter out the exceptions for iOS Safari and older Androids by checking if the error message is equal to “Script error.”.

window.onerror = function (errorMsg, url, lineNumber, column, errorObj) {
        if (errorMsg.indexOf('Script error.') > -1) {
            return;
        }

Getting Closer

The state of play in January of 2014 is that you can catch unexpected JavaScript exceptions for most desktop browsers and for Android mobiles with a recent version of Chrome for Android as well as Windows Phones. Hope this helps out other developers trying to track JavaScript errors on public sites where you can’t ask the user for help recreating errors. Roll on 2015 and better JavaScript error handling!

Git for Windows tip: opening Sublime Text from bash

I wrote a post about how to open NotePad++ from the bash prompt a few years ago but I recently made the switch to using Sublime Text 2 as my standard text editor and had to figure out how to do the same thing with Sublime. It was surprisingly difficult to find it on Google.

1. Create a text file called subl (with no extension) with the following content:

#!/bin/sh
"C:\Program Files\Sublime Text 2\sublime_text.exe" $1 &

2.  copy it into the C:\Program Files (x86)\Git\bin folder.

The first line indicates that this is a shell script. The first part of the second line is the path to the Sublime exe. The $1 parameter passes in any parameters so that you can use it like this from the bash prompt (command line) to open a file:

subl text.txt

or

subl .

to open the current folder.

The last parameter & indicates that it should open Sublime in the background so that you can continue using the command prompt.

Øredev 2013 – Day 1 (the first half)

2013-11-06 13.01.18

This is my third year in a row attending the Øredev conference. The last two years were totally fantastic so I was really looking forward to this year’s edition. This year I travelled with a large group from Tradera (my new job)  and me switching jobs made some sessions more interesting and others less so. For example, mobile stuff is much more important to me now.

I’m not feeling as ambitious as in previous years with my blogging so check out my colleague, Daniel Saidi’s blog for more detailed reviews of sessions. I will mostly focus on my favourite sessions and try and examine them in more detail rather than cover all the sessions I attended. With that said, let’s go!

Scaling Mobile Development at Spotify – Per Eckerdal and Mattias Björnheden

This session was interesting for me because it ties in so closely with the work I am doing at Tradera right now. Per and Mattias gave us a before and after story of how they changed the technical and organizational structure of their mobile app development. The story starts with two mobile teams, 30 developers in the iOS team and 20+ developers in the Android team.

This didn’t work too well for them so they changed their organizational structure to cross-functional teams that each own a feature in the Spotify app e.g. My Music or social. These teams are responsible for the development of that feature both on the backend and in the mobile and desktops apps as well as in their web player. These features are loosely coupled and for the most their only connection to another feature is to call it to open it. Spotify also changed their branching strategy to have one main branch and use toggles/feature flags to control when new features are released.  This allows them to have shorter release cycles (every 3 weeks).

This organizational change required changing their architecture as well. They had a core library which a core team worked on and then specific apis for each platform. So for example the Android team had an api called Orbit that they used to connect to core and the desktop team had an api called Stitch and the iOS team had an api called Core ObjC (I think). This architecture was a bottleneck for them as changes in core (or one of the apis) could only be done by the team that knows that part of the system. This meant waiting for another team to do the change and as Per said: Waiting sucks.

The solution was to cut away layers. The clients now all call to a common core api that is just a thin layer over the feature subsystems. The client code is moved down a layer to either this thin core api layer or into the feature subsystem. They make just one call to fetch data (view aggregation). The idea is that a feature should work pretty much the same in the different clients and that the clients should do as little as possible in the the platform specific code.

This idea of view aggregation is very interesting. We face a similar situation with our web and mobile clients at Tradera. The client makes a call and gets the whole view model (view data) in one clump and then shows that to the user. This means there will be duplication at the api level. Per from Spotify explained that this is a deliberate design choice.  I am working on a web app and if we applied this in our case this would mean making our ASP.NET MVC controllers dumb (we would be using them just to create html) or maybe eliminating them altogether.

Per and Mattias explained more about how they use feature toggles/flags and then showed off their inbuild QA tools in the Spotify apps. They recommended that everyone build these types of QA tools and I for one, will be ripping off some of their ideas in the near future. Especially the login chooser they showed for switching between different test users so that you don’t have to remember test logins or passwords.

Nice session. It was great to hear how another company solved the problem of multiple platforms by both changing their organization as well their architecture. The video is already available on Øredev’s website.

Less is More! – Jon Gyllenswärd and Jimmy Nilsson

“The root cause of getting stuck in a rut is if we are carrying a large codebase” – Jimmy Nilsson

This session was about the story of how Sirius International Insurance rewrote a monolithic codebase into a set of subsystems. Jon is a former colleague so I couldn’t miss this one! Sirius is a reinsurance company, basically a company that insures other insurance companies so that they can spread the risk in the case of large catastrophes. The system in focus here simulates the outcome of these large catastrophes.

The Sirius story contains a similar theme to the one in the Spotify session. It is always interesting to see examples of architectures in real life and on a larger scale than the toy examples used in most tech sessions.

The first interesting idea from this session was building new service balloons (as they called them). Instead of building a new feature into the old monolithic system they built it as isolated service on the side. This worked well for them but it wasn’t enough.

Sirius met Jimmy after watching one of his sessions at Øredev in 2011 (pretty cool that the conference inspired them to make the change) and invited him to help them out. They got the business to buy into the idea of rewriting the system and were given 9 months to rewrite the system and create a new UI as well.

The basic architecture style is that each subsystem owns its own data AND its own UI. This leads to some duplication of both data and of concepts. One of the ways they got around this self-imposed design limitation is to have a shared-data subsystem. However this also owns its UI. So if you want a dropdown list of regions in the UI then you would fetch the whole component from the shared-data subsystem (both the UI and backend parts). Not sure I can apply this to my current project but thought-provoking nonetheless.

They also changed the organization of their teams during this rewrite (just like Spotify did) but in a totally different way. They went back to specialized teams rather than having cross-functional teams e.g. UI and database teams. Their experience is that developers enjoyed this more and that it was worth the overhead of the extra meetings. I think I’ll have to eat lunch with Jon soon and discuss this more as it is a totally different approach to what we use at Tradera.

Jimmy presents some of the interesting solutions they came up with during the project like saving the serialized object graphs from their domain model to json files instead of using a database. All part of their keep it simple motto. The video can be found here.

As I want to go to bed now, I’ll write about the rest of day one tomorrow. It was great I saw Woody Zuill’s session on Mob Programming so stay tuned for more.

Find the Hidden Pull Request Info on Github

I review quite a few pull requests on Github and always thought it strange that Github does not show the repository url of the fork on which the pull request came from. I’ve always had to navigate through a few pages to find it. I need this url to add it as a remote locally and pull in the changes so that I can review them.

But I’ve had this vague memory that someone on Twitter mentioned that it is possible to find the url on the pull request page. I went through my Twitter favourites and couldn’t find anything. A while ago I (re)discovered this little Github secret.

I’m writing this down mostly as a reminder for myself. Here it is, click the i:

GithubInfo

When you click this, Github shows all the steps to do the merge manually and *ta-da* the fork’s url as an http url or a git url.

GithubMergeInfo

Build Your Open Source .NET Project On Travis CI

Travis CI is a continuous integration service that lives in the cloud and is free for public Github repositories. When you push a change to your Github repo, Travis CI will automatically detect it and run a build script. It works for all branches and pull requests as well and has some really nice integration with Github. In the screenshots of the Github Pull Requests below you can see the first Pull Request has a Good to merge label and the second one failed.

SafeToMergePRTravis

FailedPRTravis

Travis CI supports loads of languages but not C# and the reason is that Travis CI only supports Linux servers. Although Windows support seems to be on the way.

Being a core committer for FluentMigrator, an OSS .NET project, this is actually just what I was looking for. We have a Teamcity server (thank you Jetbrains and Codebetter) but we don’t have any testing for Mono and Linux. I had seen that the git-tfs project (also .NET and C#) was using Travis CI and thought I’d try and copy their build script. But it was not as simple as that! Here is my guide to getting a .NET project to build on Travis CI.

Sign up for Travis CI

The first step is to sign up on the Travis CI website. You can only sign up for Travis CI via your Github login which makes sense as the service focuses on CI for Github projects only. After signing in you should see your name in the top right corner so click on that to open your profile.

TravisEnableRepo

Enable the Github hook for Travis CI by selecting the appropriate repository (daniellee/FluentMigrator in my case). And that is all you need to do. If the repository contains a file called .travis.yml then it will try and build it. This is triggered after every push to the repo.

XBuild

The second step is to create an MSBuild Xml file that can be run with XBuild. XBuild is the Mono version of MSBuild and uses the same file format. The simplest build script describes which .NET version to build the project in, the platform (x86 or AnyCPU) and the name of the solution file. Here is the MSBuild file for FluentMigrator:

<?xml version="1.0"?>
<Project ToolsVersion="4.0" DefaultTargets="CI" xmlns="http://schemas.microsoft.com/developer/msbuild/2003">

  <Target Name="CI" DependsOnTargets="Build" />

  <Target Name="Build">
    <MSBuild Projects="FluentMigrator (2010).sln" Properties="Configuration=Debug;Platform=x86" />
  </Target>

</Project>

Create A Travis YAML File

The next step is to create a .travis.yml file. A file with the extension .yml is a YAML file, a file format sort of like JSON but without all the curly braces. Check out the documentation for all the options that can be defined in the YAML file. Here is the YAML file for FluentMigrator:

language: c

install:
  - sudo apt-get install mono-devel mono-gmcs nunit-console

script:
  - xbuild CI.proj
  - nunit-console ./src/FluentMigrator.Tests/bin/Debug/FluentMigrator.Tests.dll -exclude Integration,NotWorkingOnMono

This needs a bit of explanation. Travis CI runs on Ubuntu Linux so before running this script .NET/Mono is not installed so we have to install everything before trying to build and test the project.

As C# and .NET are not supported by Travis we set the language to C.

The install part of the script uses Ubuntu’s package manager, apt-get (Chocolatey is the Windows version) to fetch Mono, the Mono C# Compiler (MCS) and the NUnit console runner. We need MCS to be able to compile our C# code. We need the Mono Development Tools (mono-devel) as it contains Mono 4.0, a CLR implementation that works on Linux. And the NUnit console runner is needed to run tests from the command line.

The first task in the script step is to use xbuild to build the MSBuild file. For FluentMigrator this builds the main solution file that contains all the projects.

The second task is to run all the NUnit tests from one of the test projects. I did try and run NUnit via the MSBuild script but gave up as it was much easier to do this way. There is one very important gotcha to note here. All the examples of using the NUnit console runner use a forward slash (/) for the switches even the man pages (Linux help pages) for nunit-console. It took me a while but I eventually noticed that in the NUnit documentation that it mentions that on Linux you should use a hyphen (-) instead and then either a space or colon after the switch. E.g.  I use the exclude switch to exclude some categories of tests like this: –exclude Integration,NotWorkingOnMono

Deploy It!

Now it is time to cross your fingers and do a git push to your repo on Github. I’m sorry but there is no way it is going to work first time unless you have already spent some time building it on Linux. It took me seven attempts to get it to build successfully and another five attempts before I got all the tests to pass.

Potential Pitfalls

Here is a list of all the problems I ran into. Though I’m sure that there are loads of other problems that could occur in your project.

Linux is case sensitive

There is a class named SqliteQuoter in FluentMigrator (with exactly that casing) and I got the following slightly baffling error on my first run:

error CS2001: Source file `Generators/SQLite/SqliteQuoter.cs’ could not be found

When I looked at the actual filename (it looked perfectly correct in Visual Studio) I saw that it had this casing: SQLiteQuoter. As just changing the casing of the filename is not a change in Git you have to explicitly rename the file.

git mv -f SQLiteQuoter.cs SqliteQuoter.cs

The next casing problem was just as baffling. It turned out that in the csproj file a reference to System.Data.SQLite.dll looked like this: System.Data.SQLite.DLL. And that meant that Linux could not match the filenames. I fixed that by manually editing the csproj file and manually changing the case.

I got stuck on another issue for a while but it turned out that it was nothing to do with Travis CI or Linux. After that was fixed I got a green build but the test runner did not run. The problem was the one I talked about before with the NUnit console runner and using a hyphen instead of a forward slash.

NewLine

Travis CI now ran all of FluentMigrators’ tests (except for the integration tests) and had 21 failing tests out of 1254. Most of the failing tests were due to the new line problem. FluentMigrator is (was) littered with \r\n which is the Windows new line character (Carriage Return and Line Feed). In Linux a new line is \n (Line Feed) only. The rather tedious solution to this was to go through the code and replace all of instances of \r\n with Environment.NewLine.

File Paths

A much harder to solve issue is file paths. They are fundamentally different on Windows and Linux. For some tests I could use Path.Combine and Path.DirectorySeparatorChar to get them to pass but others had to be ignored (for now).

And at attempt number twelve I had FluentMigrator being built and all the tests run successfully on Mono and Ubuntu Linux. And there are not a lot of open source .NET projects that can say that.

Next Step

Travis CI has support for MySql, Postgres and Sqlite and it would be fantastic if I could get all the integration tests running against them. Next week maybe.

Hope this helps out some of the other OSS .NET projects.